--- Compiling #TidyTuesday Information for 2023-11-07 ----
--- There is 1 file available ---
--- Starting Download ---
Downloading file 1 of 1: `house.csv`
--- Download complete ---
house <-tuesdata$house
cleandata<-house %>%filter(stage =="GEN"& year=="2022") %>%select(state, stage, party, candidatevotes) %>%drop_na(party) %>%filter(party %in%c("DEMOCRAT", "REPUBLICAN")) #total votes for each party in each state totalvotes <- cleandata %>%group_by(state, party) %>%summarise(total =sum(candidatevotes)) %>%slice(which.max(total))
`summarise()` has grouped output by 'state'. You can override using the
`.groups` argument.
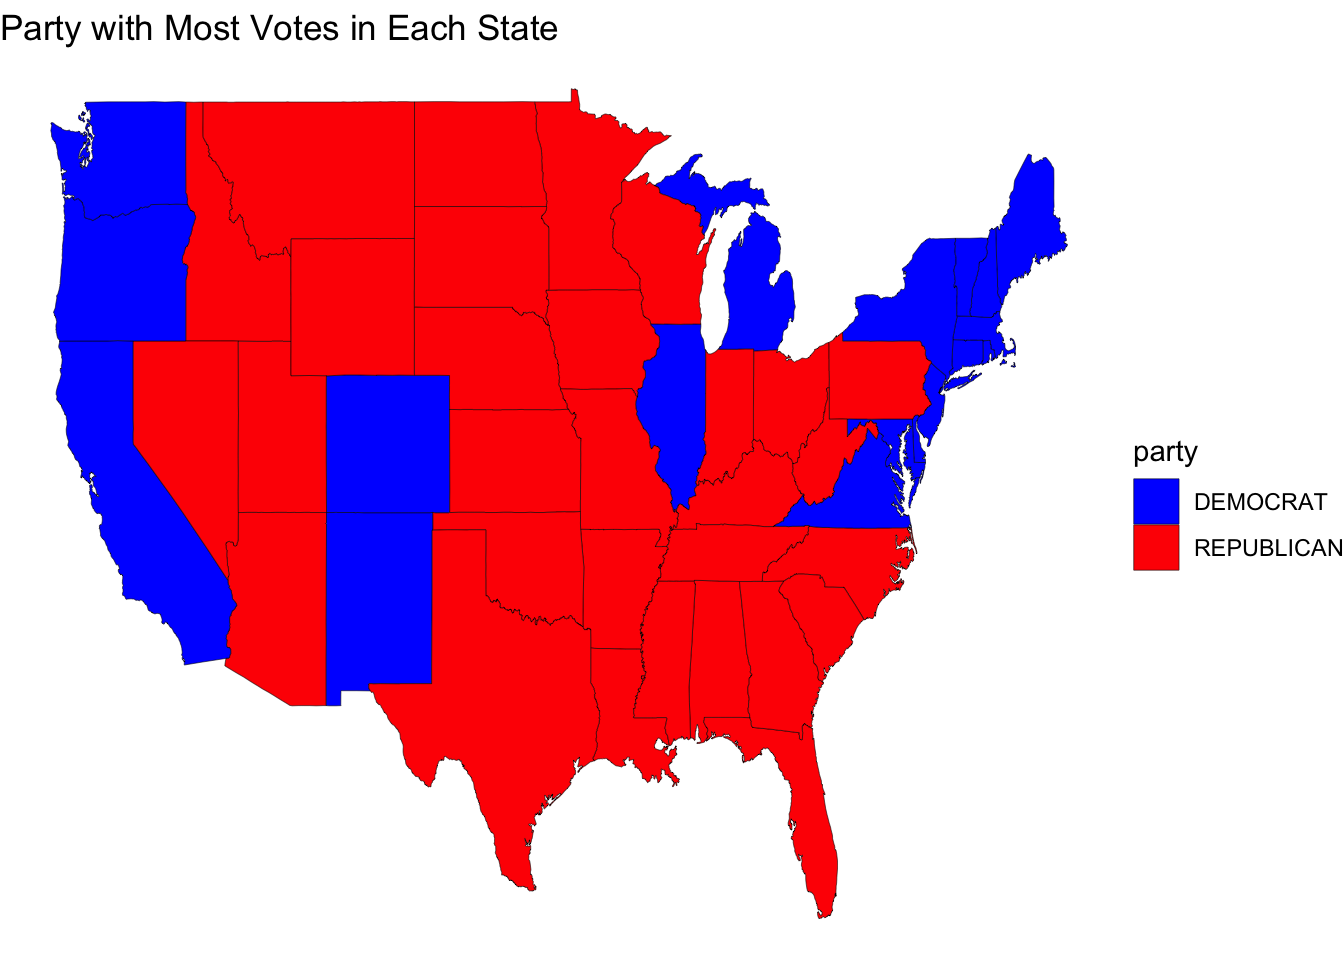
totalvotes <- totalvotes[!(totalvotes$state =="ALASKA"| totalvotes$state=="HAWAII"),] usmapp <-map_data("state")#it has to match state in map_data functiontotalvotes$state <-tolower(totalvotes$state)electiondf <-left_join(totalvotes, usmapp, by =c("state"="region"))ggplot(data = electiondf, aes(x= long, y= lat, group = group, fill= party))+geom_polygon(color="black", size =0.1) +scale_fill_manual(values =c("DEMOCRAT"="blue", "REPUBLICAN"="red")) +# Set colors for partieslabs(title ="Party with Most Votes in Each State") +theme_void()
Warning: Using `size` aesthetic for lines was deprecated in ggplot2 3.4.0.
ℹ Please use `linewidth` instead.
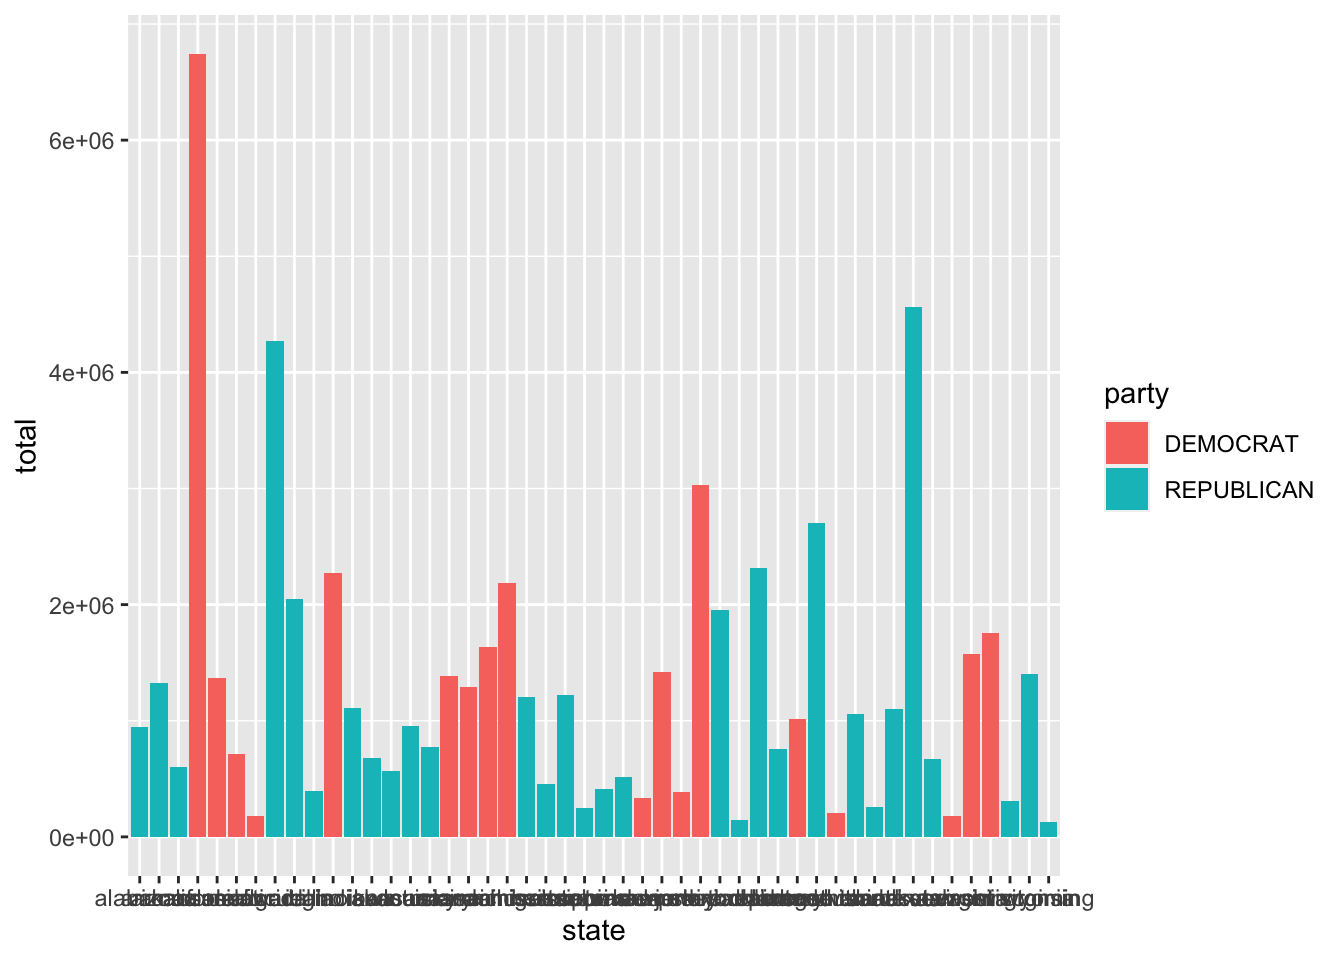
#who won tht most votes in each state? mostvotes <- totalvotes %>%group_by(state) %>%top_n(1,total) #skipped Alaska and Hawaii because map_data functiom does not contain eithermostvotes <- mostvotes[!(mostvotes$state=="ALASKA"| mostvotes$state=="HAWAII"),]#visualise it ggplot(data = mostvotes, aes(x= state, y= total, fill= party)) +geom_bar(stat ="identity", position ="dodge")