library(ggpubr)
Condition <-rep(c("No \n Transient","Transient"), each=2)
Location <-rep(c("Outside","Inside"),2)
MMRT <- c(304,300,290,280)
CI_upper <-c(315,310,304,290)
CI_lower <-c(295,290,283,270)
plot_df <-data.frame(Condition,Location,MMRT,CI_upper,CI_lower)
plot_df$Location <- factor(plot_df$Location,
levels = c("Outside","Inside"))
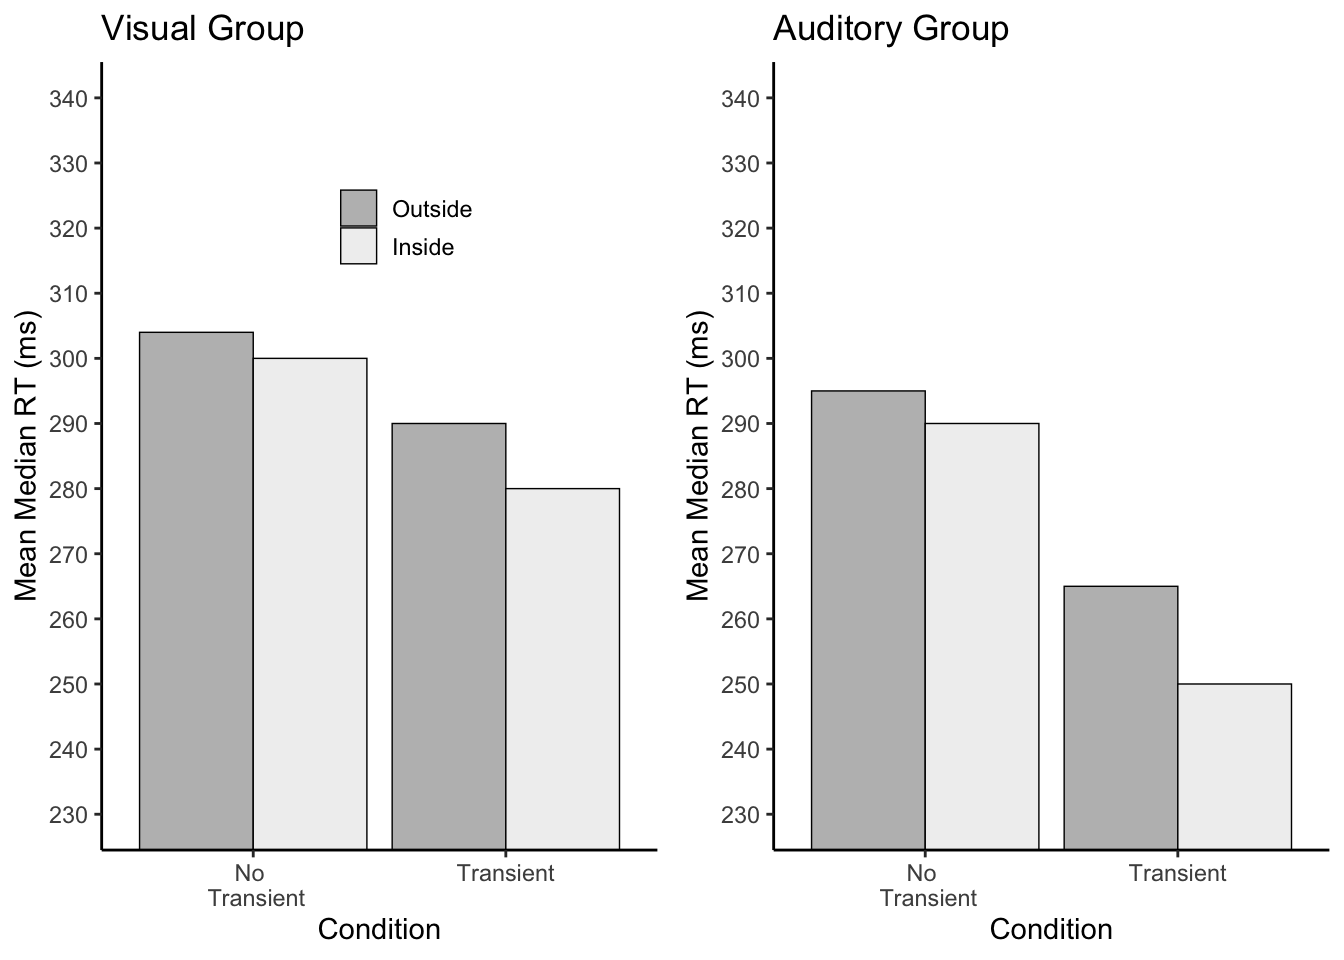
vis<-ggplot(plot_df, aes(x=Condition, y=MMRT, group=Location,
fill=Location))+
geom_bar(stat="identity",position="dodge",
color="black",
size=.25)+
theme_classic()+
ylab("Mean Median RT (ms)")+
coord_cartesian(ylim=c(230,340))+
scale_y_continuous(breaks=seq(230,340,10))+
scale_fill_brewer(palette="Greys", direction=-1)+
theme(legend.position=c(0.55,0.8),
legend.title=element_blank(),
legend.key.size = unit(.5, "cm"))+
ggtitle("Visual Group")
Condition <-rep(c("No \n Transient","Transient"), each=2)
Location <-rep(c("Outside","Inside"),2)
MMRT <- c(295,290,265,250)
CI_upper <-c(305,300,275,260)
CI_lower <-c(285,280,255,240)
plot_df <-data.frame(Condition,Location,MMRT,CI_upper,CI_lower)
plot_df$Location <- factor(plot_df$Location,
levels = c("Outside","Inside"))
aud<-ggplot(plot_df, aes(x=Condition, y=MMRT, group=Location,
fill=Location))+
geom_bar(stat="identity",position="dodge",
color="black",
size=.25)+
theme_classic()+
ylab("Mean Median RT (ms)")+
coord_cartesian(ylim=c(230,340))+
scale_y_continuous(breaks=seq(230,340,10))+
scale_fill_brewer(palette="Greys", direction=-1)+
theme(legend.position="none")+
ggtitle("Auditory Group")
ggarrange(vis,aud)